
In 2026, the web isn’t just a desktop experience; it’s predominantly mobile. For web developers, designers, and even savvy digital marketers, understanding how a website behaves on an actual iPhone screen is absolutely critical. But unlike the robust developer tools readily available in desktop browsers, figuring out how to inspect element on iPhone isn’t immediately obvious. You don’t get a right-click ‘Inspect’ option popping up. This article cuts through the confusion, providing a clear, step-by-step guide to mastering web page inspection directly from your iPhone, leveraging both Apple’s built-in remote debugging capabilities and exploring practical alternatives.
Why Inspect Element on iPhone? The Mobile Debugging Imperative

You might be asking, “Why bother with inspecting elements directly on an iPhone when I can just use my desktop browser’s responsive design mode?” That’s a valid question, and the answer is rooted in the practical realities of mobile web development. A desktop browser’s responsive mode is a simulation, an approximation of how your site might look and behave. It’s incredibly useful for initial layout checks, but it simply cannot replicate the nuances of a real device. Here’s why true iPhone inspection is indispensable:
- Accurate Rendering Engine Behavior: Safari on iOS uses WebKit, which has its own quirks and rendering specifics that can differ from Chrome, Firefox, or even Safari on macOS. Real-device inspection shows you exactly how WebKit handles your HTML, CSS, and JavaScript.
- Touch Event Handling: Desktop simulations use mouse clicks to mimic touch. Real iPhones use multi-touch gestures, swipe events, and specific touch delays. Debugging these interactions requires the actual hardware.
- Device Performance: A powerful desktop machine handles complex JavaScript and animations differently than an iPhone, especially older models. Inspecting on-device allows you to profile actual load times, animation smoothness, and resource consumption specific to mobile hardware.
- Viewport and Safe Area Issues: iOS devices have specific viewport behaviors, including the “notch” or “Dynamic Island” and bottom safe areas that can affect layout. Debugging these visually on the device is crucial.
- Network Conditions: Mobile devices often operate on cellular networks with varying speeds and latency. The Network tab in a remote inspector provides real-world data that desktop simulations can’t reliably offer.
- Accessibility Features: Testing how your site interacts with VoiceOver or other iOS accessibility features requires hands-on device interaction and visual inspection.
Ignoring these mobile-specific factors is a common pitfall that leads to frustrating user experiences and difficult-to-track bugs. Mastering how to inspect element on iPhone bridges this critical gap between development and real-world usage.
The Primary Method: Remote Debugging with Safari Web Inspector (Mac Required)
The most robust and officially supported way to inspect elements on an iPhone involves connecting it to a Mac and using Safari’s built-in Web Inspector. This method provides the full suite of developer tools you’d expect from a desktop browser, but operating against the live page on your connected iOS device.
Step 1: Prepare Your iPhone
Before you even plug anything in, you need to enable the developer settings on your iPhone. This is a one-time setup.
- On your iPhone, open the Settings app.
- Scroll down and tap on Safari.
- Scroll to the bottom and tap on Advanced.
- Toggle on Web Inspector.
This setting essentially grants permission for a connected Mac to access and debug web content running in Safari on your iPhone.
Step 2: Prepare Your Mac
Your Mac’s Safari browser also needs a quick adjustment to reveal its developer menu.
- Open Safari on your Mac.
- From the menu bar at the top of your screen, go to Safari > Settings… (or Safari > Preferences… on older macOS versions).
- Click on the Advanced tab.
- At the very bottom, check the box that says “Show Develop menu in menu bar.”
You’ll now see a new “Develop” menu item appear in Safari’s top menu bar.
Step 3: Connect Devices and Enable Debugging
With both devices ready, it’s time to link them up.
- Connect your iPhone to your Mac using a Lightning-to-USB or USB-C-to-USB-C cable, depending on your device models. A reliable physical connection is best.
- On your iPhone, if prompted, tap “Trust This Computer” and enter your passcode. Your Mac also might ask if you want to allow the connected device to access your data; approve it.
- Open Safari on your iPhone and navigate to the webpage you want to inspect.
This handshake establishes the secure communication channel necessary for remote debugging.
Step 4: Open Safari on Your Mac and Access Web Inspector
Now, bring up the developer tools on your Mac.
- On your Mac, open Safari.
- From the top menu bar, click on Develop.
- Hover over your iPhone’s name (e.g., “John’s iPhone 15 Pro”).
- In the submenu that appears, you’ll see a list of open Safari tabs on your iPhone. Click on the URL of the page you wish to inspect.
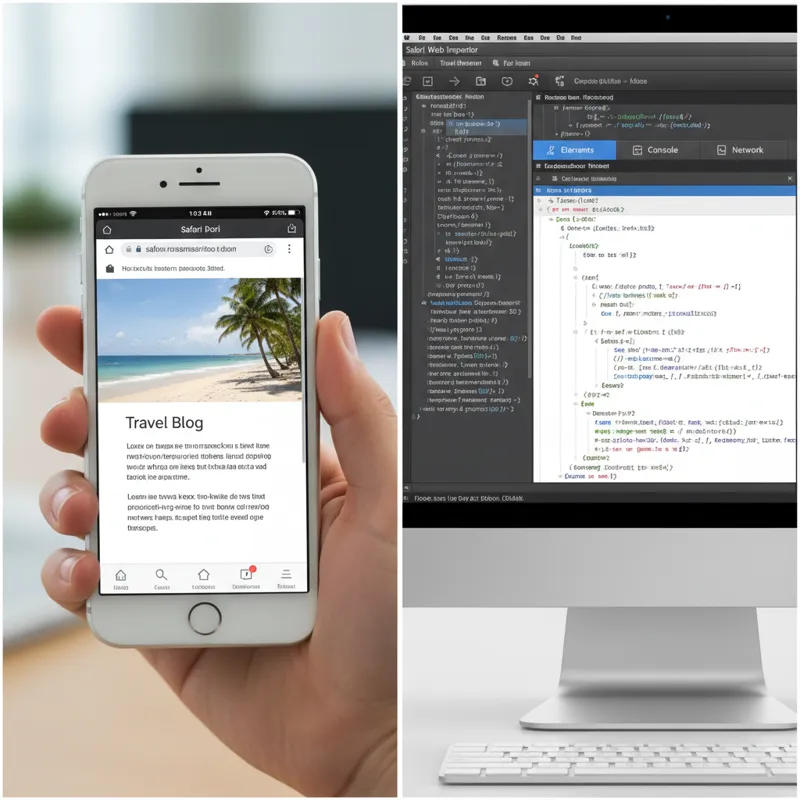
A new window will pop up on your Mac – this is the Safari Web Inspector, now actively debugging the live webpage on your iPhone.
Step 5: Start Inspecting and Debugging
Congratulations! You now have a full-fledged developer console for your iPhone’s Safari browser. Any action you take within the Web Inspector on your Mac (e.g., changing CSS, running JavaScript in the console, inspecting network requests) will instantly reflect on the iPhone’s screen. Conversely, interacting with the page on your iPhone (tapping buttons, scrolling) will show corresponding events and changes in the Web Inspector.
This powerful connection is how professional web developers truly get to the bottom of mobile-specific issues. For developers, especially those juggling multiple browser instances, simulators, and heavy dev tools, a high-performance drive is non-negotiable. If you’re building out a new workstation or upgrading an existing one, understanding which drives offer the best blend of speed and reliability can significantly cut down on compile times and improve overall system responsiveness. You might find a good overview on an SSD tier list invaluable for making an informed choice.
Understanding the Safari Web Inspector Interface

The Safari Web Inspector shares many commonalities with developer tools in other browsers, but knowing its specific layout and functionality is key to effectively inspect element on iPhone.
Elements Tab (HTML/CSS)
This is your primary window into the page’s structure and styling. Here, you can:
- Inspect HTML: Browse the entire DOM (Document Object Model) tree of the webpage. Clicking on an element here will highlight it on your iPhone’s screen.
- Modify CSS: View all applied CSS rules for the selected element, including inherited styles. You can live-edit properties, add new rules, and see the changes instantly on your iPhone. This is incredibly useful for tweaking layouts and testing responsiveness.
- Examine Box Model: Visualize padding, border, and margin values for any element.
- Event Listeners: See which JavaScript event handlers are attached to an element.
Console Tab (JavaScript Errors/Logs)
The Console is where your JavaScript comes to life (or dies). It’s crucial for debugging client-side logic.
- Error Reporting: Any JavaScript errors on the page will be logged here, complete with file names and line numbers, helping you pinpoint issues.
console.log()Output: All messages generated by yourconsole.log(),console.warn(), orconsole.error()calls from your web page’s JavaScript will appear here.- Execute JavaScript: You can type and execute JavaScript code directly in the console against the live page on your iPhone. This is invaluable for testing functions, manipulating the DOM, or checking variable states.
Network Tab (Requests/Responses)
Performance and data fetching are paramount on mobile. The Network tab reveals everything about how your page loads its resources.
- Resource Waterfall: See a timeline of every request (HTML, CSS, JS, images, fonts, XHR, etc.) made by the page, their load order, and duration.
- Request/Response Details: Click on any resource to view its full HTTP headers, payload, and response content. This is essential for debugging API calls and understanding server communication.
- Performance Metrics: Analyze total load times, individual resource sizes, and overall page performance on the actual device’s network conditions.
Storage Tab (Local Storage/Cookies)
Many web applications rely on client-side storage for user preferences, session data, and offline capabilities. The Storage tab lets you inspect and manipulate these.
- Local Storage & Session Storage: View and edit key-value pairs stored in these browser APIs.
- Cookies: Inspect all cookies set for the current domain, including their values, expiration dates, and domain/path information.
- IndexedDB: Debug data stored in IndexedDB databases.
Responsive Design Mode
While remote debugging focuses on actual device behavior, Safari’s desktop Responsive Design Mode (accessible via Develop > Enter Responsive Design Mode) is still useful for quick checks on various screen sizes and resolutions before connecting your iPhone. However, always remember it’s a simulation; the remote Web Inspector provides the real picture when you inspect element on iPhone.
Alternative Approaches: Inspecting on iPhone Without a Mac (Limitations Apply)
What if you don’t have a Mac handy, or you need a quick peek at something directly on your iPhone? While these methods don’t offer the comprehensive power of the Safari Web Inspector, they can provide basic insights. It’s important to manage expectations here; these are workarounds, not full-fledged debugging solutions.
Third-Party iOS Web Inspectors/Browsers
The App Store offers a range of browsers and utilities that attempt to bring developer tools to iOS. These are often custom browsers built with some inspection capabilities.
- How They Work: These apps typically embed a basic web view (WKWebView) and add their own interface for displaying HTML, CSS, and sometimes even a rudimentary console. They might parse the DOM and present it in a tree view, allowing you to tap elements to see their styles.
- Limitations:
- Security Risks: Be cautious with third-party apps, especially those that claim extensive access. Always check reviews and developer reputation.
- Limited Functionality: They rarely match the depth of Safari’s Web Inspector. You might get HTML and CSS viewing, but advanced features like network profiling, JavaScript debugging with breakpoints, or storage inspection are usually absent or highly simplified.
- Performance Differences: The web view they use might behave slightly differently than the native Safari browser on your device, introducing inconsistencies.
- When to Use: For quick sanity checks on live CSS values, or to verify HTML structure on the go, without a Mac. They are not suitable for deep debugging.
Even debugging can be a more pleasant experience when you’re working in a comfortable, inspiring environment. Some developers find that stepping away from the main desk for a focused session, perhaps with a laptop on a well-chosen piece of furniture, can boost productivity. While not directly technical, creating an inviting workspace, maybe with one of the best coastal coffee table ideas for 2026, can make those long hours a little more enjoyable.
Viewing Page Source Directly in Safari
Safari on iOS has a hidden trick for viewing the raw HTML source of a page, though it’s not an “inspector” in the traditional sense.
- Open Safari on your iPhone and navigate to the webpage.
- In the address bar, type
view-source:directly before the URL and press Go. For example, if the URL ishttps://www.example.com, you would typeview-source:https://www.example.com.
This will display the raw HTML source code of the page. You can copy it, but you can’t interact with it or see the live CSS or JavaScript. It’s useful for verifying server-side rendered HTML or checking for specific tags, but has minimal debugging utility.
Alternatively, some iOS Safari extensions (available via the App Store) can add a “View Source” option to the Share Sheet, providing a slightly more convenient way to access this basic functionality.
Safari Reader View and Request Desktop Website
These aren’t inspection tools, but they can sometimes help diagnose display issues by changing how Safari renders a page:
- Reader View: When available (tap the ‘AA’ icon in the address bar), Reader View strips away most CSS, JavaScript, and extraneous elements, focusing solely on the article content. If your page looks fine in Reader View but broken otherwise, it suggests a CSS or JavaScript conflict.
- Request Desktop Website: Also accessible via the ‘AA’ icon, this tells the website to serve its desktop version instead of the mobile one. This can help identify if layout issues are due to your mobile-specific CSS or a broader problem.
Neither of these allows you to inspect element on iPhone, but they offer quick diagnostic perspectives when you’re without your Mac.
What Most People Get Wrong When Inspecting on iPhone
Even with the right tools, it’s easy to fall into common traps when you try to inspect element on iPhone. Being aware of these can save you significant time and frustration.
- Forgetting to Enable Web Inspector on the iPhone: This is the most frequent culprit for the “iPhone not showing up in Develop menu” problem. Always double-check
Settings > Safari > Advanced > Web Inspector. - Untrusting the Computer: If you haven’t trusted your Mac on your iPhone, or if the trust expires (sometimes after updates or prolonged disconnection), the Mac won’t be able to communicate. Look for the “Trust This Computer” prompt on your iPhone.
- Relying Solely on Simulator: The iOS Simulator (part of Xcode) is fantastic for testing different device sizes and OS versions, but it’s still an emulator. It doesn’t fully replicate real-world performance, touch gestures, or network conditions. Always test on a physical device.
- Using the Wrong Cable or Port: A faulty or charge-only USB cable can prevent the data connection needed for remote debugging. Ensure you’re using a quality data cable and a functioning USB port on your Mac.
- Safari Browser/macOS/iOS Version Mismatches: While generally backward compatible, very old versions of Safari on either device, or vastly different macOS/iOS versions, can sometimes cause communication issues. Keeping everything updated is usually best practice.
- Not Being on the Target Page: The Web Inspector only works for currently open Safari tabs on your iPhone. If you switch tabs or navigate away, the inspector might disconnect or show outdated information. Always ensure your iPhone is on the page you intend to debug.
- Ignoring Console Warnings: Developers often focus only on red error messages. However, console warnings can indicate deprecated features, potential performance bottlenecks, or non-standard practices that will eventually lead to bigger problems.
Advanced Tips for Efficient Mobile Web Development in 2026
Once you’re comfortable with the basics of how to inspect element on iPhone, consider these advanced techniques to streamline your mobile web development workflow:
- Breakpoints for JavaScript Debugging: In the Web Inspector’s Sources tab, you can set breakpoints in your JavaScript files. When the code execution hits a breakpoint, it pauses, allowing you to step through code line by line, inspect variable values, and understand the flow of your application. This is invaluable for complex client-side logic.
- Performance Profiling: The Audits (or Performance) tab in Web Inspector allows you to record and analyze your page’s performance. Look for high CPU usage, long script execution times, layout thrashing, and excessive painting. Optimizing these can dramatically improve the user experience on mobile.
- Network Throttling: To simulate real-world network conditions (e.g., 3G, slow Wi-Fi), you can use the Network tab’s throttling options. This helps you understand how your site performs for users with less-than-ideal connections.
- Accessibility Audits: Modern Web Inspectors include tools to help you identify accessibility issues, such as missing ARIA attributes, insufficient color contrast, or improperly structured headings. Developing for accessibility from the start is not just good practice, it’s increasingly a legal requirement.
- Using Safari Technology Preview: For bleeding-edge features and the latest WebKit enhancements, consider installing Safari Technology Preview on your Mac. It often includes new Web Inspector features before they land in stable Safari, giving you a sneak peek and early access to powerful debugging tools.
Late-night debugging sessions are often fueled by coffee, and for many, managing energy and health is key. Opting for healthier alternatives can make a difference in sustaining focus. If you’re looking to cut down on sugar without sacrificing flavor, exploring options like the 5 ultimate sugar free coffee creamer picks might be a small but impactful change to your daily routine.
Remember that the landscape of web development is always evolving. Staying updated with the latest browser features and debugging techniques ensures your projects remain robust and performant on all devices, especially the ubiquitous iPhone.
Frequently Asked Questions (FAQ)
Here are some common questions people have when trying to inspect element on iPhone:
Can I inspect element on iPhone without a Mac?
Yes, but with significant limitations. While some third-party iOS apps offer basic HTML and CSS viewing, and you can use view-source: in Safari, these methods do not provide the full debugging capabilities (like JavaScript console, network analysis, or live editing) that Safari Web Inspector offers via a Mac connection. For professional debugging, a Mac is essential.
Do I need Xcode installed on my Mac for remote debugging?
No, you do not need Xcode itself to be installed. The Safari Web Inspector functionality is built directly into Safari on macOS. However, if you develop iOS apps, you likely already have Xcode, which includes the necessary drivers and components for robust device communication.
Why is my iPhone not showing up in the Develop menu on my Mac?
Several reasons could cause this:
- Web Inspector Disabled: Ensure
Settings > Safari > Advanced > Web Inspectoris toggled ON on your iPhone. - Develop Menu Not Enabled: Verify
Safari > Settings > Advanced > "Show Develop menu in menu bar"is checked on your Mac. - “Trust This Computer” Pending: Your iPhone might be waiting for you to tap “Trust This Computer” after connecting it to your Mac.
- Bad Cable/Port: Try a different USB cable or a different USB port on your Mac.
- Software Updates: Ensure both your macOS and iOS are reasonably up-to-date.
Can I debug web pages in other iOS browsers like Chrome or Firefox?
Yes, but they also require a Mac. Chrome and Firefox on iOS essentially use Apple’s WebKit rendering engine (the same as Safari). To debug them, you still connect your iPhone to a Mac, but instead of using Safari’s Develop menu, you typically use the desktop Chrome or Firefox’s developer tools. These browsers have their own remote debugging protocols that connect to their respective iOS apps, which in turn use WebKit for rendering.
Is it possible to inspect elements on an iPad using the same method?
Absolutely. The process for inspecting elements on an iPad is identical to that for an iPhone. You enable Web Inspector in iPadOS Safari settings, connect the iPad to your Mac, and select its tab from Safari’s Develop menu.
Conclusion
Mastering how to inspect element on iPhone isn’t just a technical skill; it’s a fundamental requirement for anyone serious about delivering high-quality web experiences in 2026 and beyond. The ubiquitous nature of mobile browsing demands that web content renders flawlessly and performs optimally on actual devices. While the direct ‘right-click inspect’ isn’t available, Apple’s remote debugging via Safari Web Inspector on a Mac provides an incredibly powerful and comprehensive toolset for achieving this.
By following the simple steps outlined, you can bridge the gap between desktop development and real-world mobile usage. Embrace the full power of remote debugging, understand the nuances of the Web Inspector, and leverage those insights to build web pages that delight users, no matter what iPhone they’re holding.


